6.1 Types (D, DA, acceptor intensity image)
6.2 Live preview
6.3 Snapshot
6.4 Mapping
6.5 Defining exposure time
6.6 Acquiring images
6.1 Types (D, DA, acceptor intensity image)
In the image acquisition process, users can select the type of experiment they wish to conduct, choosing between acquiring donor-only (D) or donor-acceptor (DA) images. If it’s the first time acquiring images, the default option is set to donor-only (D), while subsequent acquisitions default to donor-acceptor (DA).
Donor Acquisition (D):
Initially, the software measures the fluorescence lifetime of the ATTO488 fluorophore, serving as the donor fluorophore in the QF-Pro® assay, under donor-only conditions. This measurement is conducted for all Regions of Interest (ROIs) within the donor-only sample using laser excitation, generating intensity and phase-lifetime images simultaneously.
Donor-Acceptor Acquisition (DA):
Subsequently, on the corresponding Donor + Acceptor (DA) sample, the software measures the fluorescence lifetime of the donor fluorophore (ATTO488) in the presence of the acceptor fluorophore. If the acceptor fluorophore is within a 10nm proximity, indicative of protein interaction, energy transfer occurs from the donor to the acceptor, resulting in a decrease in the donor lifetime. Similar to donor acquisition, laser excitation is used, generating intensity and lifetime images simultaneously.
Acceptor Intensity Image Acquisition:
Following DA sample acquisition, the software automatically switches to measure the intensity of the acceptor fluorophore using the 594nm LED channel. This provides information on the expression level of the acceptor fluorophore, with the LED intensity typically set at 100% transmittance and a recommended exposure time of 50ms. These images serve for visualizing acceptor intensity values and do not influence QF-Pro® readouts.
When setting up image acquisition with the LED594 light source, users should carefully adjust LED intensity, exposure time, and filter settings to optimize signal-to-noise ratio while minimizing photobleaching and background noise. Proper calibration of the microscope and light source is essential to maintain accuracy and consistency. Additionally, optimizing focus and selecting an appropriate region of interest ensures clear and precise imaging. All samples require donor and DA images, while only DA samples require the acceptor intensity image.
FRET Image Acquisition:
FRET image acquisition captures donor-acceptor pairs to detect energy transfer, revealing molecular interactions and protein conformation changes. Using appropriate light excitation, the software analyzes fluorescence emission properties to quantify energy transfer efficiency, providing insights into cellular processes and disease mechanisms. Further explanation will be provided later in conjunction with the explanation of QF-Pro maps (section 4.8.Generating QF-Pro maps).
6.2. Live preview
The Live Preview is an option within the image acquisition window that, when selected, displays in real-time what the microscope objective is seeing. This feature allows users to observe immediate feedback while making manual adjustments such as changing LED channels or adjusting stage movement. The ability to see in real-time what is being displayed on the screen enables users to confirm they are capturing exactly what they desire and helps them make precise adjustments for optimal results. It’s an invaluable tool for ensuring the quality and accuracy of the acquired images. When the live is on, the “Start live view” button will become the “Stop live view” button.
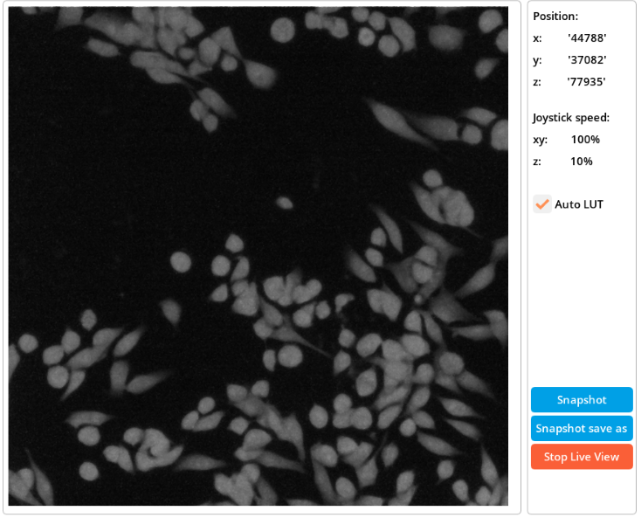
Live preview window
6.3. Snapshot
The snapshot function enables the user to capture and save the image that is displayed on the screen with the live preview. To do this, in the “Acquisition” window, while the “Live preview” is activated, the user has to press the “Snapshot” or the “Snapshot save as“ button, to save it directly into the working directory or to browse for a new location.
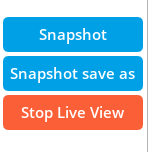
Snapshot buttons
6.4. Mapping
Within the acquisition window, the Violet 3.0 system offers a mapping feature that allows users to create a grid of points for targeted sample analysis. To utilize this feature, users can access the table of points in the “Acquisition” window, where they have the option to add points manually. By using the “Live preview”, users can maneuver the joysticks to navigate the sample area until they identify a specific point they wish to capture, and when located, users can simply press the “Add” button to include it in the mapping grid. Users can continue adding points to the table by repeating this process, and when the acquisition is done, all of this points will be individually acquired and analyzed.
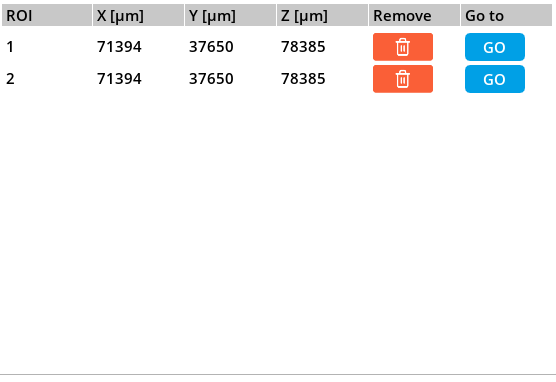
Mapping grid
6.5. Defining exposure time
The Violet 3.0 system offers a flexible range of exposure times, spanning from 100µs to 2s, which can be adjusted within the “Acquisition” window, in the “Camera settings”. For optimal results, it’s recommended to set an exposure time of 800ms for QF-Pro® acquisitions. Users can utilize the live preview feature to assess image quality before capture, enabling adjustments as necessary to achieve the desired outcome.
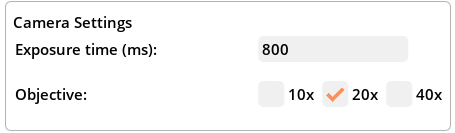
Exposure time in camera settings panel
-
Low signal samples: in cases of low signal samples, increasing the exposure time to 1s may be beneficial. However, exceeding this threshold often results in an increase in background noise proportionate to the signal, thereby failing to improve the signal-to-noise ratio.
-
High intensity samples: for exceptionally intense samples, where intensity values exceed 0.66, a lower exposure time such as 300ms can be employed. This scenario is uncommon, and for most applications, an exposure time of 800ms remains optimal.
6.6. Acquiring images
When ready to acquire images, users should press the “Acquire” button in the “Acquisition” window. Upon activation, the system displays the acquired images on the screen, categorized by type (intensity or phase lifetime), acquisition mode (D or D+A), and snap number (if applicable, in the case of mapping for acquiring images from multiple points). This acquisitions can be edited and analyzed in the “Experiment results” window.
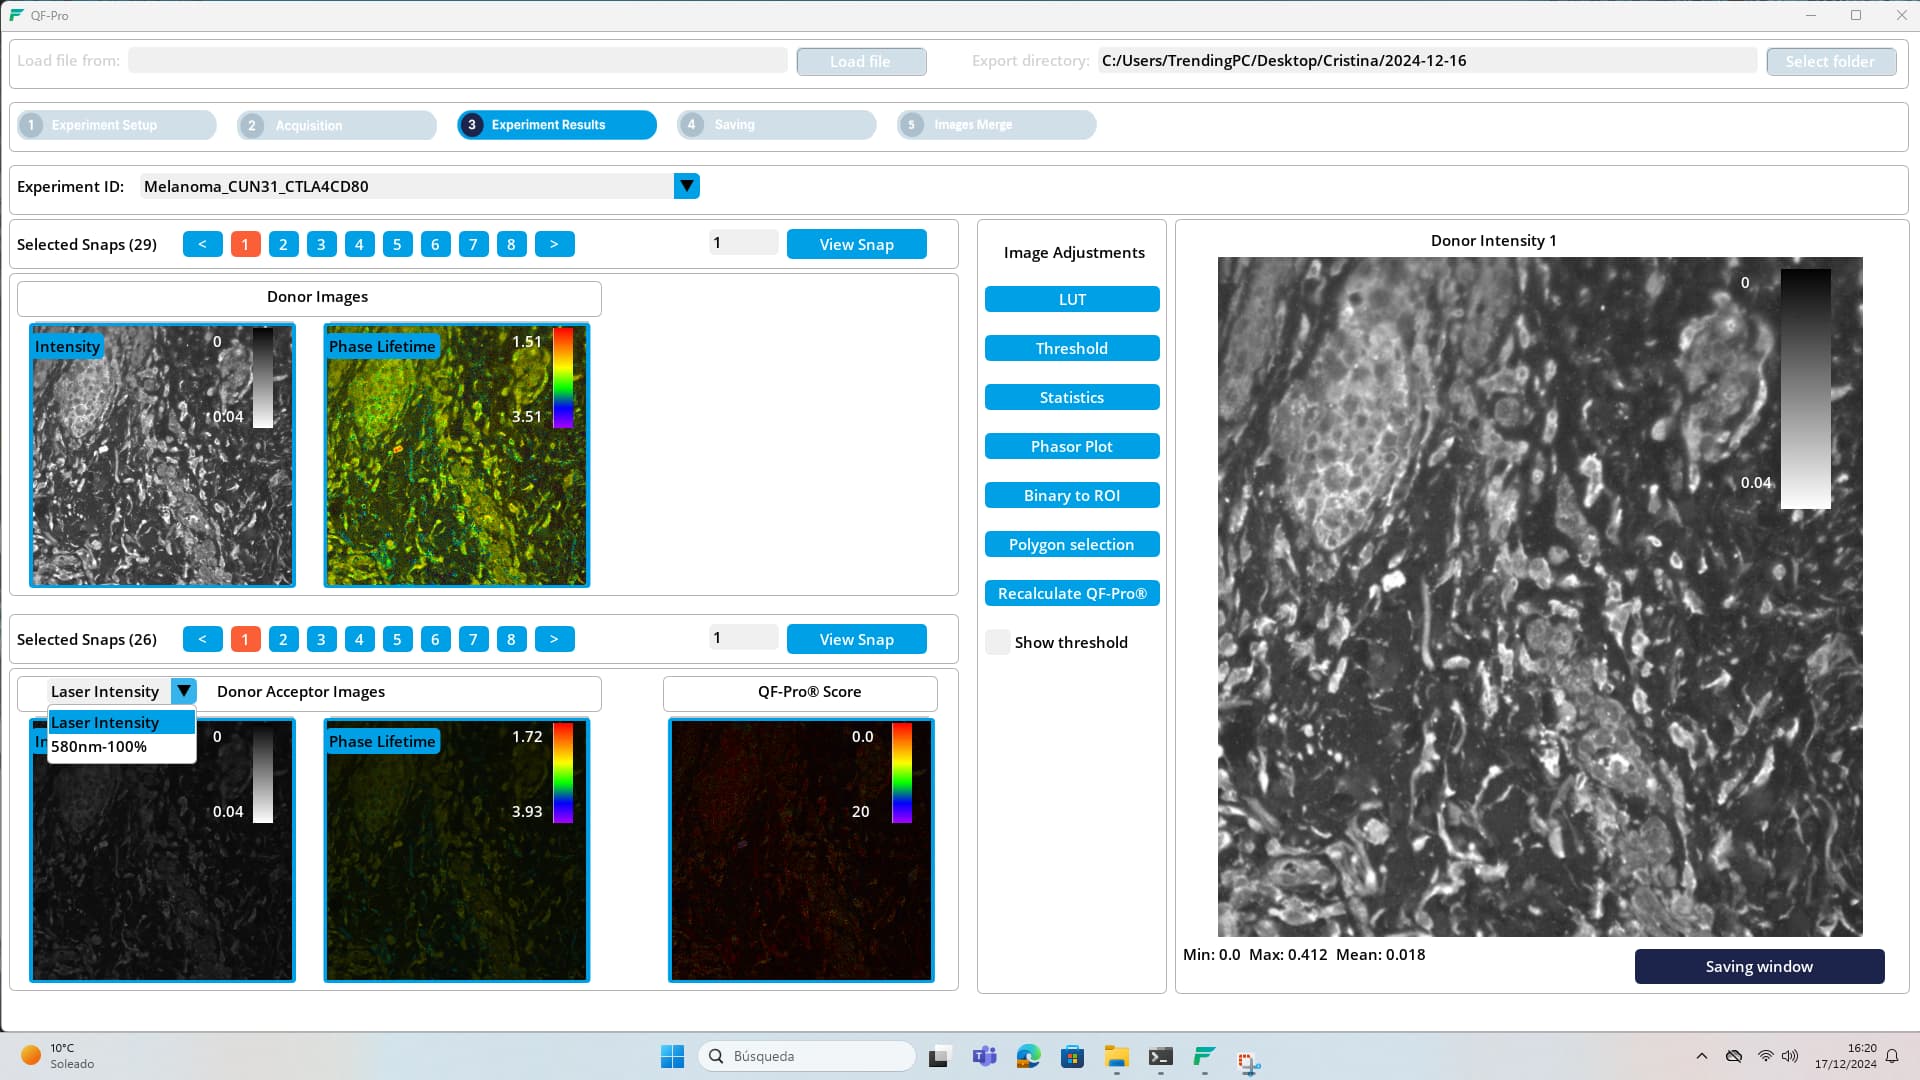
Results window
Users have the option to save the acquired images in two formats: TIFF or PNG. TIFF (Tagged Image File Format) preserves the image without any alterations, making it suitable for retaining high-quality image data and preserving details. On the other hand, PNG (Portable Network Graphics) is recommended for saving images that have been processed (using features such as LUT adjustments, thresholding, or other enhancements), as it maintains transparency and allows for lossless compression, albeit resulting in larger file sizes compared to TIFF.
Go to next section: 7.- Image analysis